Usage
Filters
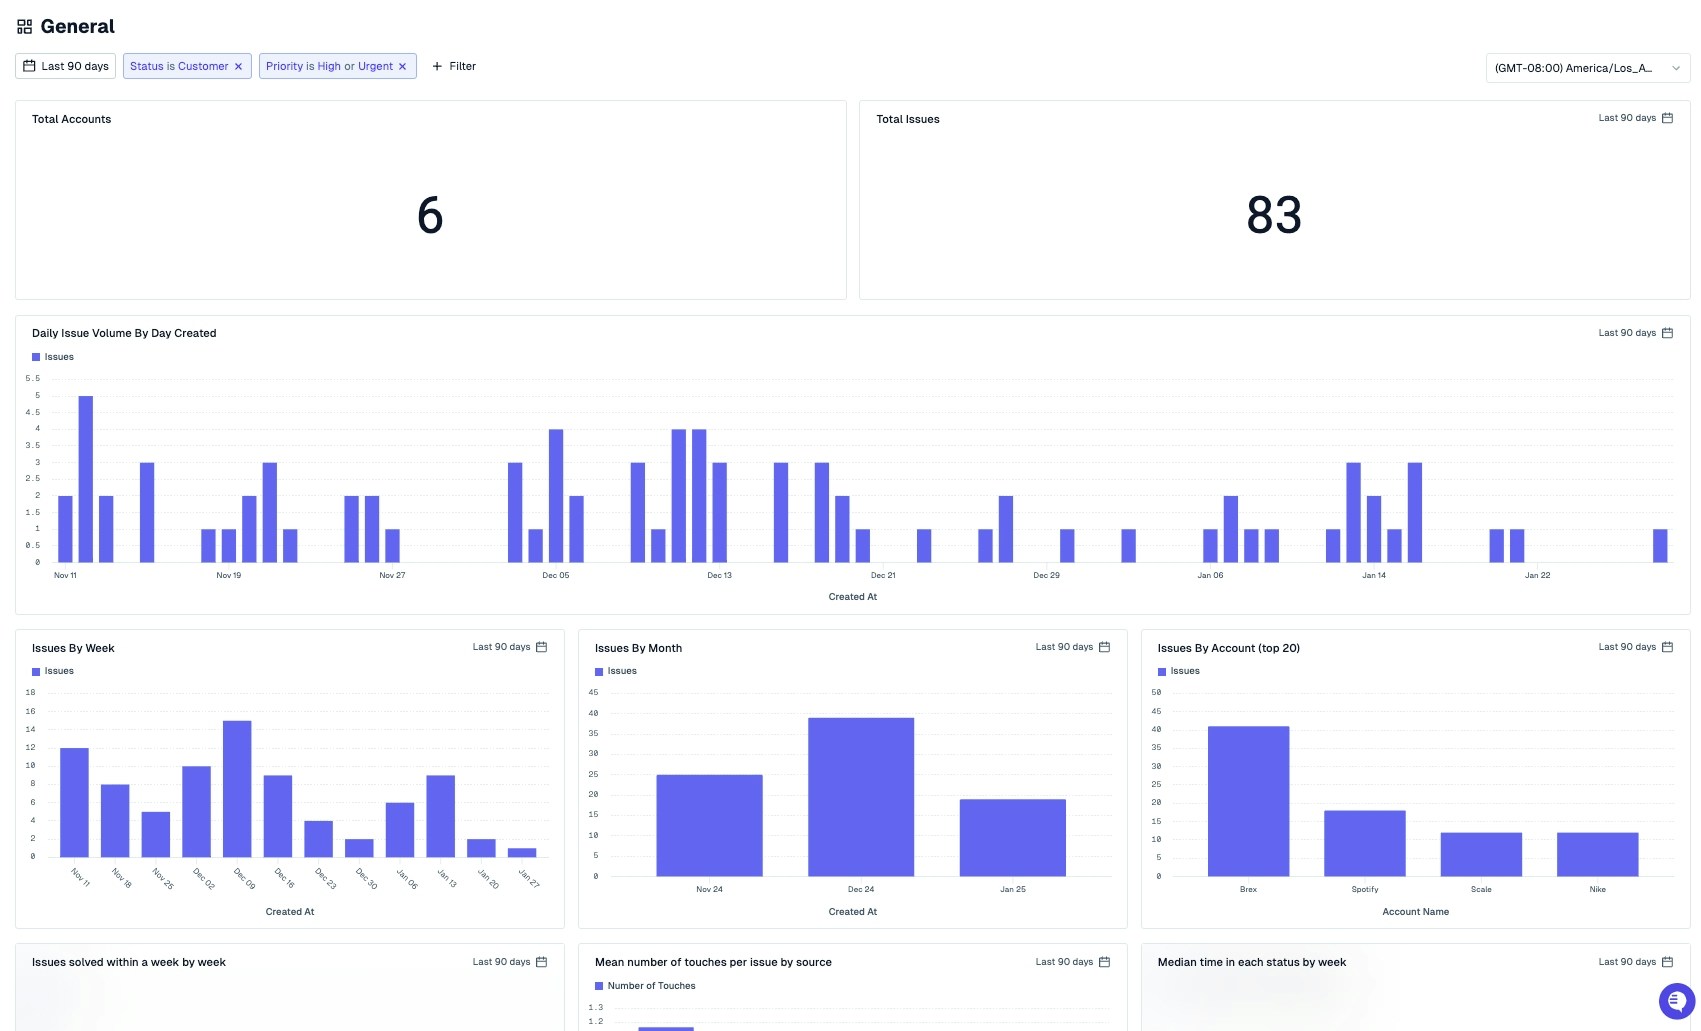
Add filters at the top of each dashboard to scope data by time or properties of issues, accounts, or contacts.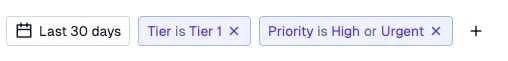
Graphs
-
Hover over graphs for additional information
- Print dashboards to share out
- View graphs in fullscreen mode for easier presentations
- Keyboard shortcuts for quick graph and dashboard navigation and inspection
- Drilldown into charts to dig into underlying data